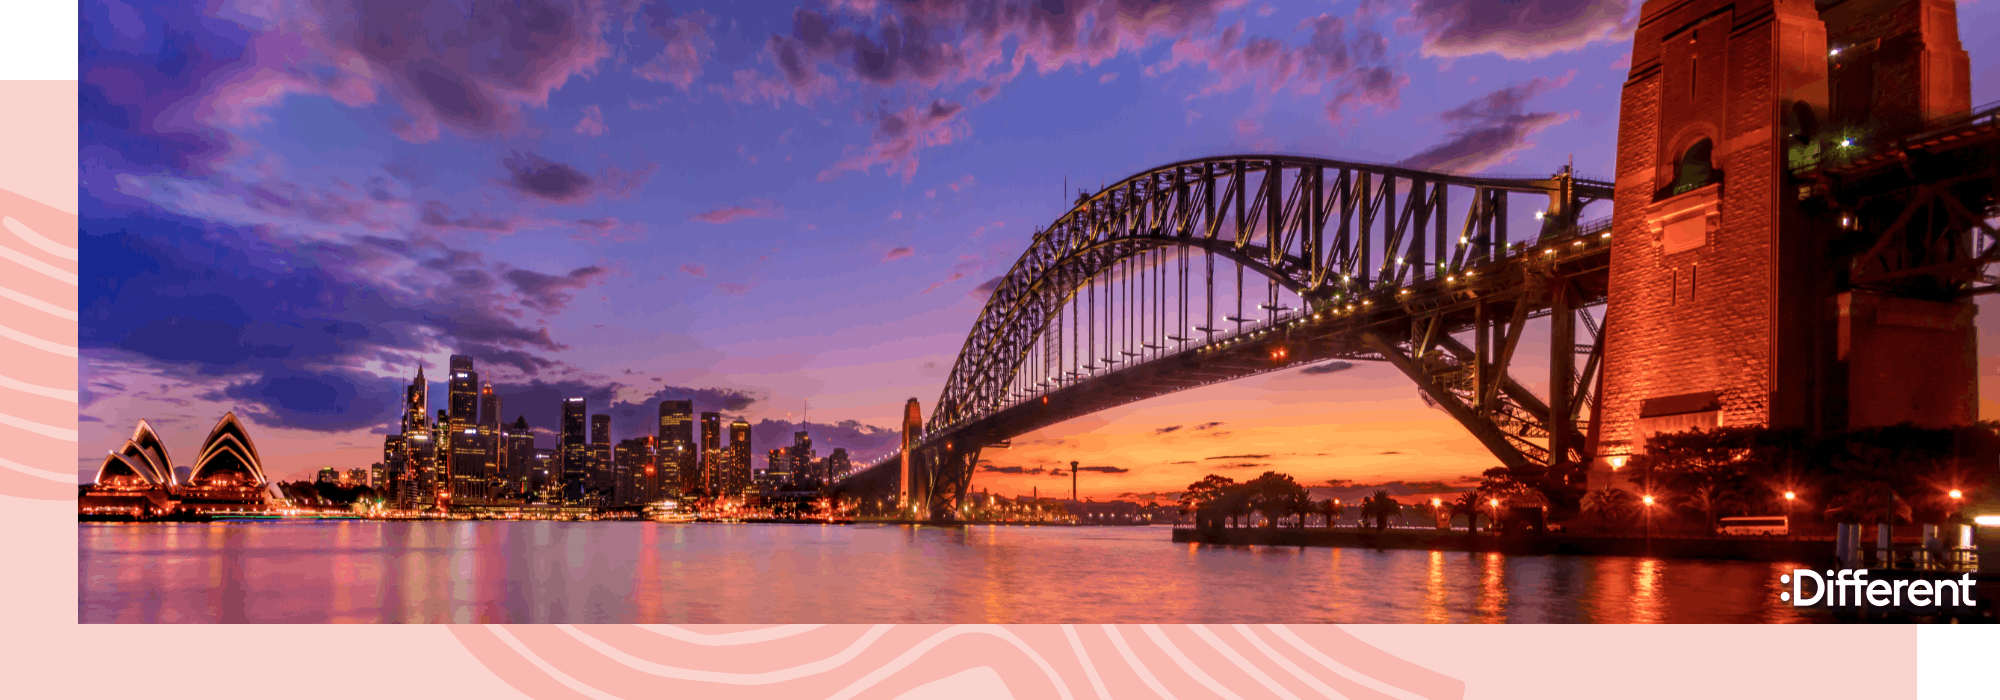
Sydney’s property market has been shaped by its postcard-worthy landmarks, world-class universities, and exciting metropolitan life. And the fact that stunning landscapes are just a short drive away only adds to its allure.
These reasons continued to fuel the rental property prices in the past. But the pandemic brought Sydney’s rental market trend to a screeching halt!
Inner-city dwellers such as tenants renting out apartment units or city centre homes can now look out for lower rental rates. Border controls and little to no tourism have been a nasty surprise for property investors. This compelled rental reductions of up to 4.8% since March.
If you’ve been thinking about how the market conditions will affect your rental property income, have a look at the information on the average rent in Sydney and Sydney rental market statistics we’ve put together for you below.
What is the average rent in Sydney?
The average rent in Sydney is $540 for houses and $495 for units, according to a Domain rental report (December 2020).
This is a 1.9% increase for houses since the previous quarter, and a 1% drop for apartments.
Average rent in Sydney over the past 5 years
The investor boom between 2013 and 2017 led to a peak in rental trends during 2017 and 2018. Since then, average rent in Sydney has seen a dip through 2019 and 2020. These rental market trends were accelerated by the COVID-19 pandemic, but the average rent in Sydney has bounced back after an initial plunge.
In general, the current rental market is influenced by higher bargaining power for tenants, with a decrease in demand. This is because many investment properties have been converted to long-term rentals instead of short-term holiday rentals.
Median rent in Sydney for houses from the past 5 years (2016-2020):
The median rent in Sydney for houses peaked in 2017 and 2018, and has seen a decrease in later years. In the third quarter of 2019, median house rent in Sydney was at its lowest since March 2017. Since then, median rent for houses in Sydney has impressively bounced back in 2020 despite the COVID-19 pandemic.
- Sydney median weekly house rent 2020: $540.
- Sydney median weekly house rent 2019: $525.
- Sydney median weekly house rent 2018: $600.
- Sydney median weekly house rent 2017: $600.
- Sydney median weekly house rent 2016: $540.
Source: Propertyology report on historical rent performance in Sydney.
Median rent in Sydney for units from the past 5 years (2016-2020):
The median rent in Sydney for units peaked in 2017 and 2018, and has seen a decrease in later years. Average rent for units over the last 5 years is continuing on a downward trajectory through 2020, being at its lowest point in over 4 years.
- Sydney median weekly unit rent 2020: $495
- Sydney median weekly unit rent 2019: $510
- Sydney median weekly unit rent 2018: $550
- Sydney median weekly unit rent 2017: $550
- Sydney median weekly unit rent 2016: $520
Source: Propertyology report on historical rent performance in Sydney.
Average rent in Sydney by suburb or area
Suburb/Region | Average weekly rent |
|---|---|
Baulkham Hills and Hawkesbury | $550 |
Blacktown | $430 |
Central Coast | $420 |
Sydney CBD | $530 |
Inner Inner West (Annandale, Ashbury, Ashfield, Balmain, Dulwch Hill, Enmore, Leichhardt, Newtown) | $520 |
Inner South (Burwood, Croydon, Earlwood, Five Dock etc.) | $580 |
Inner Southwest Sydney (Bankstown, Canterbury, Hurtsville, Kogarah) | $450 |
Inner West (Canada Bay, Strathfield etc.) | $480 |
Lower North Shore | $540 |
Northern Beaches | $670 |
Outer Southwest Sydney (Camden, Campbelltown, Wollondilly) | $430 |
Parramatta | $440 |
Ryde | $450 |
Southwest Sydney (Bringelly, Fairfield, Liverpool) | $420 |
Sutherland | $530 |
Sydney Eastern Suburbs - North (Bondi, Tamarama, Centennial Park, Dover Heights, Watsons Bay) | $650 |
Sydney Eastern Suburbs - South (Coogee, Clovelly, Kensington, Maroubra, Randwick, La Perouse) | $550 |
Upper North Shore | $530 |
Top 7 growth suburbs and areas in Sydney
Central Coast is the fastest growing suburb in Sydney as of December 2020. In general, the Greater Sydney area is seeing an annual change of -2.94% in median rent. This means that most suburbs are seeing a decline in weekly average rent, and only 7 suburbs are growing or have remained stagnant. We have included these suburbs below.
Rank | Suburb/Region | Median Weekly Rent | Annual Change |
|---|---|---|---|
1 | Central Coast | $420 | 5.00% |
2 | Northern Beaches | $670 | 3.08% |
3 | Outer Southwest Sydney (Camden, Campbelltown, Wollondilly) | $430 | 2.38% |
4 | Sutherland | $530 | 1.92% |
5 | Southwest Sydney (Bringelly, Fairfield, Liverpool) | $420 | 0.00% |
6 | Blacktown | $430 | 0.00% |
7 | Baulkham Hills and Hawkesbury | $550 | 0.00% |
Top 10 suburbs and areas in Sydney with the highest median weekly rent
The Northern Beaches is the suburb in Sydney with the highest median weekly rent in December 2020.
Rank | Suburb/Region | Median Weekly Rent | Annual Change |
|---|---|---|---|
1 | Northern Beaches | $670 | 3.08% |
2 | Sydney Eastern Suburbs - North (Bondi, Tamarama, Centennial Park, Dover Heights, Watsons Bay) | $650 | -6.47% |
3 | Inner South (Burwood, Croydon, Earlwood, Five Dock etc.) | $580 | -13.43% |
4 | Sydney Eastern Suburbs - South (Coogee, Clovelly, Kensington, Maroubra, Randwick, La Perouse) | $550 | -8.33% |
5 | Baulkham Hills and Hawkesbury | $550 | 0.00% |
6 | Lower North Shores | $540 | -10.00% |
7 | Upper North Shore | $530 | -5.36% |
8 | Sutherland | $530 | 1.92% |
9 | Sydney CBD | $530 | -12.97% |
10 | Inner Inner West (Annandale, Ashbury, Ashfield, Balmain, Dulwch Hill, Enmore, Leichhardt etc.) | $520 | -11.11% |
Top 10 areas in Sydney with the highest annual change in weekly rent
Since the Greater Sydney region is overall experiencing a decline in median rent at -2.97% annually, most suburbs have seen a significant decrease. Some suburbs have been hit harder than others, with Ryde being the suburb with the highest decline as of December 2020 with an annual change of -13.46%.
Rank | Suburb/Region | Median Weekly Rent | Annual Change |
|---|---|---|---|
1 | Ryde | $450 | -13.46% |
2 | Inner South (Burwood, Croydon, Earlwood, Five Dock etc.) | $580 | -13.43% |
3 | Sydney CBD | $530 | -12.97 |
4 | Inner Inner West (Annandale, Ashbury, Ashfield, Balmain, Dulwch Hill, Enmore, Leichhardt etc.) | $520 | -11.11 |
5 | Lower North Shore | $540 | -10.00 |
6 | Sydney Eastern Suburbs - South (Coogee, Clovelly, Kensington, Maroubra, Randwick, La Perouse) | $550 | -8.33% |
7 | Inner West (Canada Bay, Strathfield etc.) | $480 | -7.69% |
8 | Sydney Eastern Suburbs - North (Bondi, Tamarama, Centennial Park, Dover Heights, Watsons Bay) | $650 | -6.47% |
9 | Inner Southwest Sydney (Bankstown, Canterbury, Hurtsville, Kogarah) | $450 | -6.25% |
10 | Upper North Shore | $530 | -5.36% |
Source: Tenants’ Union of NSW’s rent tracker.
Future projections for average rental price in Sydney
The Sydney property market is projected to grow in capital by 8-12% in 2021, according to Property update’s 2021-2022 forecast. We can mostly credit this to a post-COVID-19 recession boom.
Keep in mind that an increase in house price does not necessarily mean that the average rent will also increase, but the two usually go hand in hand. Increase in property price indicates that more people want to live in those properties or in that specific area, so an increase in rental yield can be expected with increasing demand.
The most important thing you need to know as an investor is that the Sydney house market will see a split going forward. Apartments in high rise towers, close to universities or in typical “blue collar areas” will continue to suffer. Meanwhile, high-quality properties in residential areas will see a boom.
If the market fluctuations seem like a lot to take in, we recommend bringing in professional property management in Sydney to help manage your investment property and stay on top of trends.

.png?ixlib=gatsbyFP&auto=compress%2Cformat&fit=max&rect=0%2C0%2C4000%2C1400&w=700&h=245)

